A reference that represents the cell range. The range contains all values to be described, such as "A1:A4".
boxPlotClass
Q1→25% percentile, Q3→5% percentile, IQR→Q3-Q1.
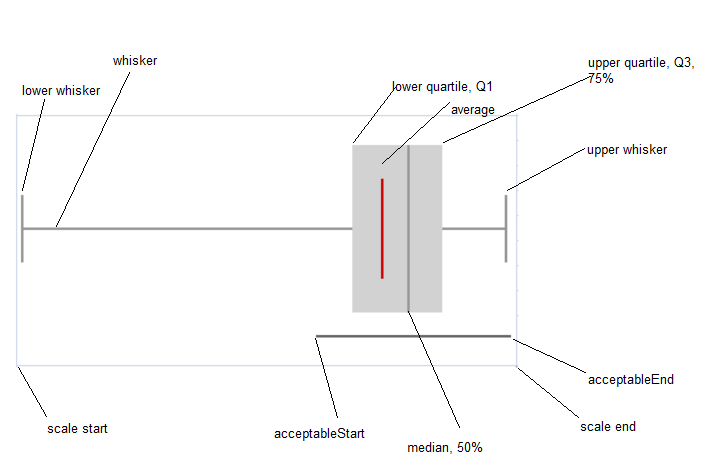
5ns: whisker ends at minimum and maximum, median, no outliers.
7ns: whisker ends at 2% percentile and 98% percentile, hatch marks at 9% percentile and 91% percentile, outliers beyond 2% percentile and 98% percentile.
tukey: whisker ends at a value (the minimum of the points between Q1 and Q1 - 1.5*IQR, use the point if it exists or use the minimum) and a value (the maximum of the points between Q3 and Q3 + 1.5 * IQR, use the point if it exists or use the maximum), outliers beyond Q1 - 1.5*IQR and Q3 + 1.5 * IQR, and extreme outliers beyond Q1 - 3 * IQR and Q3 + 3 * IQR.
bowley: whisker ends at minimum and maximum, hatch marks at 10% percentile and 90% percentile, no outliers.
sigma3: whisker ends at a value (average - 2 * StDev > scaleStart ? average - 2 * StDev : minimum) and a value (average + 2 * StDev < scaleEnd ? average = 2 * StDev : maximum), box at average +/- stdev, outliers beyond average - 2 * StDev and average + 2 * StDev, and extreme outliers beyond average - 3 * StDev and average + 3 * StDev.
showAverage
A boolean that represents whether to show the average. This setting is optional. The default value is FALSE.
scaleStart
A number or reference that represents the minimum boundary of the sparkline, such as 1 or "A6". This setting is optional. The default value is the minimum of all values.
scaleEnd
A number or reference that represents the maximum boundary of the sparkline, such as 8 or "A7". This setting is optional. The default value is the maximum of all values.
acceptableStart
A number or reference that represents the start of the acceptable line, such as 3 or "A8". This setting is optional. The default value is None.
acceptableEnd
A number or reference represents the end of the acceptable line, such as 5 or "A9". This setting is optional. The default value is None.
colorScheme
A string that represents the color of the sparkline's box. This setting is optional. The default value is "#D2D2D2".
style
A number or reference that represents the sparkline style. This setting is optional. The default value is 0 (Classical). The style can be 0 or 1.
0: the whisker is a line and outlier is a circle.
1: the whisker is a rectangle and outlier is a line.
vertical
A boolean that represents whether to display the sparkline vertically. This setting is optional. The default value is FALSE.
The following image displays the sparkline areas based on the 5ns option.
Sample Usage
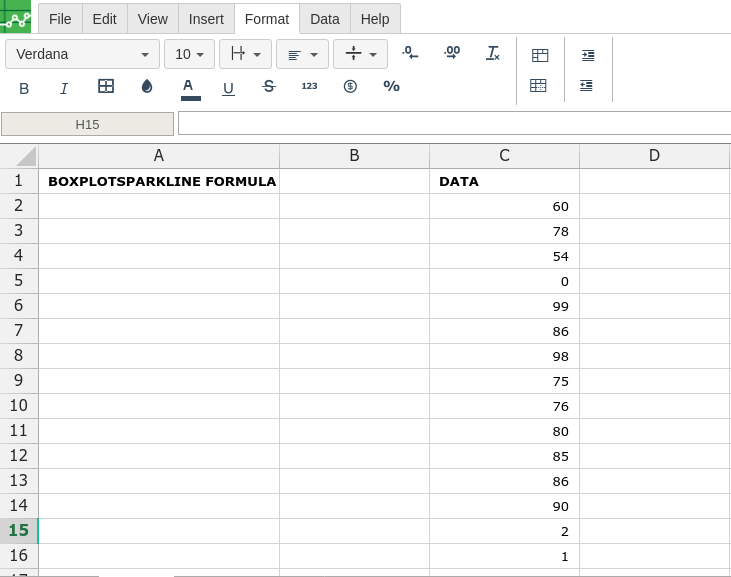
In order to use the BOXPLOTSPARKLINE formula, start with your edited Excellentable:
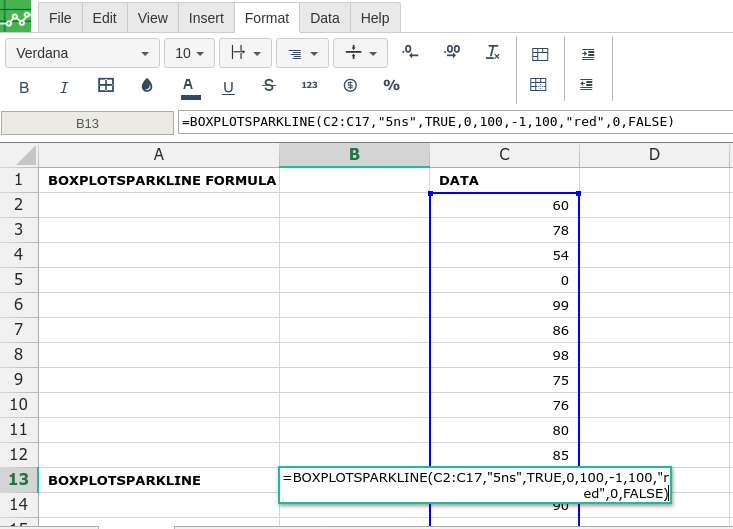
Then type in the BOXPLOTSPARKLINE formula in the area you would like to display the outcome:
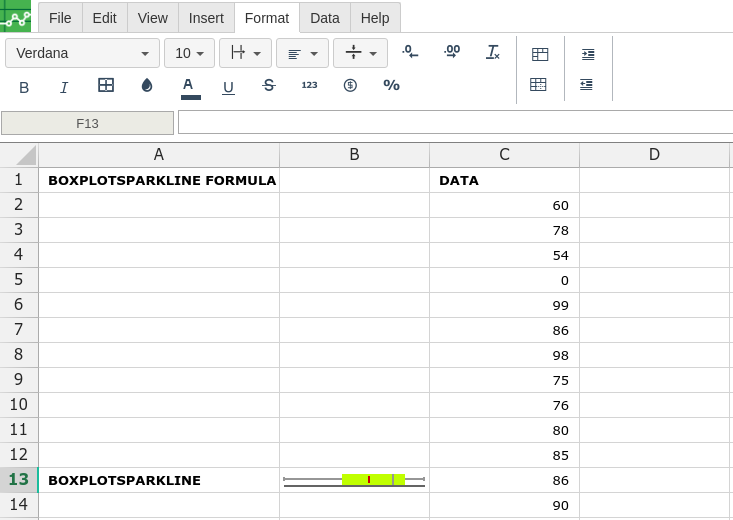
By adding the values you would like to calculate the BOXPLOTSPARKLINE formula for, Excellentable will generate the outcome:
Error rendering macro 'excellentable' : Page loading timed out
JavaScript errors detected
Please note, these errors can depend on your browser setup.
If this problem persists, please contact our support.