COVAR
Definition of COVAR
Calculates the covariance of a dataset.
Sample Usage
COVAR(A2:A100,B2:B100)
Syntax
COVAR(data_y, data_x)
data_y- The range representing the array or matrix of dependent data.data_x- The range representing the array or matrix of independent data.
Notes
Any text encountered in the
valuearguments will be ignored.Positive covariance indicates that the independent data and dependent data tend to change together in the same direction; negative indicates that they tend to change together in the opposite direction (i.e. increase in one leads to decrease in the other). The magnitude of covariance is difficult to interpret - use
CORRELorPEARSON, the normalized version ofCOVAR, to gauge strength of linear correlation.
See Also
STEYX: Calculates the standard error of the predicted y-value for each x in the regression of a dataset.
SLOPE: Calculates the slope of the line resulting from linear regression of a dataset.
RSQ: Calculates the square of r, the Pearson product-moment correlation coefficient of a dataset.
INTERCEPT: Calculates the y-value at which the line resulting from linear regression of a dataset will intersect the y-axis (x=0).
FORECAST: Calculates the expected y-value for a specified x based on a linear regression of a dataset.
COVAR: Calculates the covariance of a dataset.
CORREL: Calculates r, the Pearson product-moment correlation coefficient of a dataset.
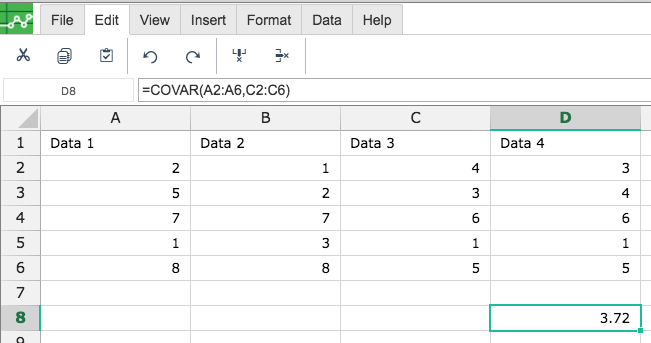
In order to use the COVAR formula, start with your edited Excellentable:
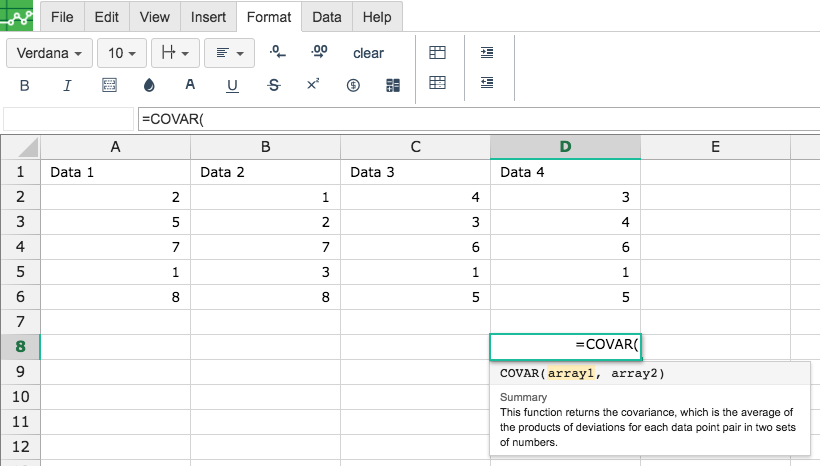
Then type in the COVAR Formula in the area you would like to display the outcome:
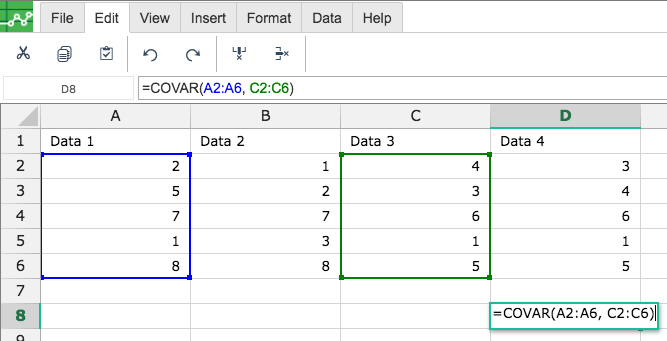
By adding the values you would like to calculate the COVAR formula for, Excellentable will generate the outcome: