COVARIANCE.P
Definition
Returns population covariance, the average of the products of deviations for each data point pair in two data sets. Use covariance to determine the relationship between two data sets. For example, you can examine whether greater income accompanies greater levels of education.
Sample Usage
Syntax
COVARIANCE.P(array1,array2)
The COVARIANCE.P function syntax has the following arguments:
Array1 Required. The first cell range of integers.
Array2 Required. The second cell range of integers.
Remarks
The arguments must either be numbers or be names, arrays, or references that contain numbers.
If an array or reference argument contains text, logical values, or empty cells, those values are ignored; however, cells with the value zero are included.
If array1 and array2 have different numbers of data points, COVARIANCE.P returns the #N/A error value.
If either array1 or array2 is empty, COVARIANCE.P returns the #DIV/0! error value.
The covariance is:
where

are the sample means AVERAGE(array1) and AVERAGE(array2), and n is the sample size.
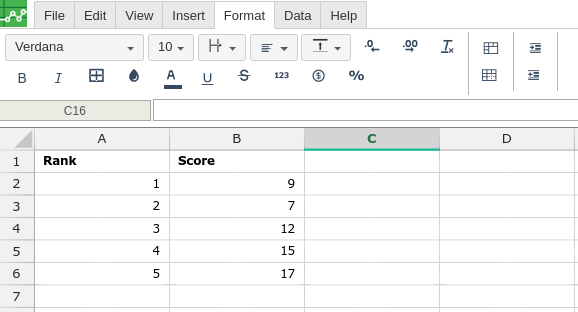
In order to use the COVARIANCE.P formula, start with your edited Excellentable:
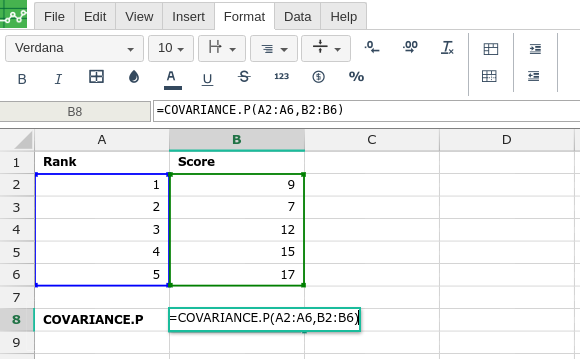
Then type in the COVARIANCE.P formula in the area you would like to display the outcome:
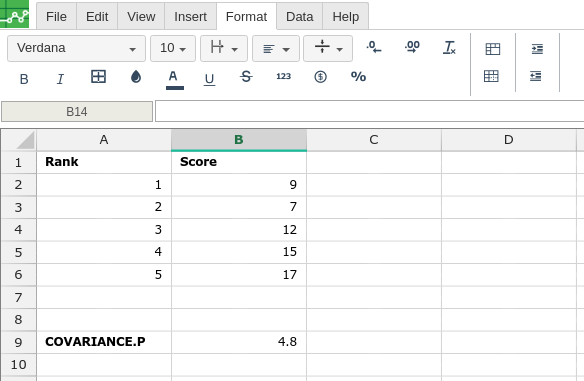
By adding the values you would like to calculate the COVARIANCE.P formula for, Excellentable will generate the outcome: