F.DIST.RT
Definition
Calculates the right-tailed F probability distribution (degree of diversity) for two data sets with given input x. Alternately called Fisher-Snedecor distribution or Snedecor's F distribution.
Sample Usage
F.DIST.RT(15.35, 7, 6)
F.DIST.RT(A2, B2, C2)
Syntax
F.DIST.RT(x, degrees_freedom1, degrees_freedom2)
x- The input to the F probability distribution function. The value at which to evaluate the function.Must be a positive number.
degrees_freedom1- The numerator of the number of degrees of freedom.degrees_freedom2- The denominator of the number of degrees of freedom.
Notes
Both
degrees_freedom1anddegrees_freedom2are truncated to an integer in the calculation if a non-integer is provided as an argument.Both
degrees_freedom1anddegrees_freedom2must be greater than1and may not exceed10^10.All arguments must be numeric.
F.DIST.RTis synonymous withFDIST.
See Also
FDIST: Calculates the right-tailed F probability distribution (degree of diversity) for two data sets with given input x. Alternately called Fisher-Snedecor distribution or Snedecor's F distribution.
F.DIST: Calculates the left-tailed F probability distribution (degree of diversity) for two data sets with given input x. Alternately called Fisher-Snedecor distribution or Snecdor's F distribution.
TDIST: Calculates the probability for Student's t-distribution with a given input (x).
Examples
In this example, suppose you want to determine whether the data for hours spent studying each week have different variability for engineering majors at University A than at University B. We will evaluate the curve of F Distribution when xequals 15.35, and use 7 and 6 for degrees_freedom1 and degrees_freedom2 respectively.
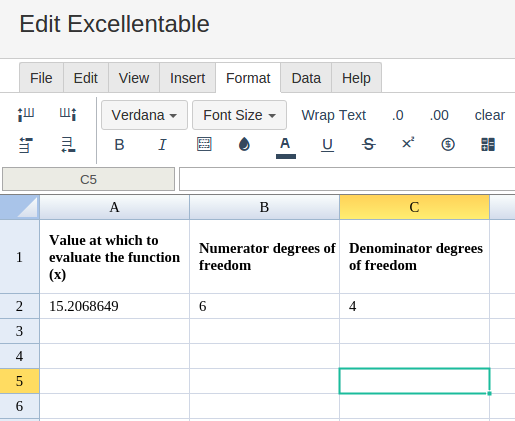
In order to use the F.DIST.RT formula, start with your edited Excellentable:
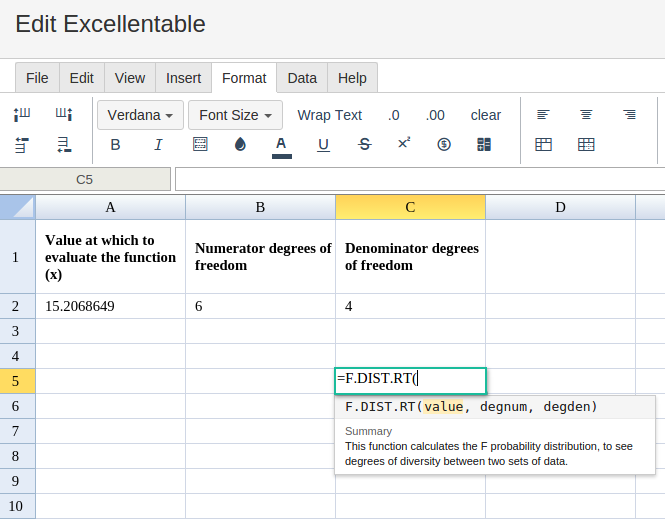
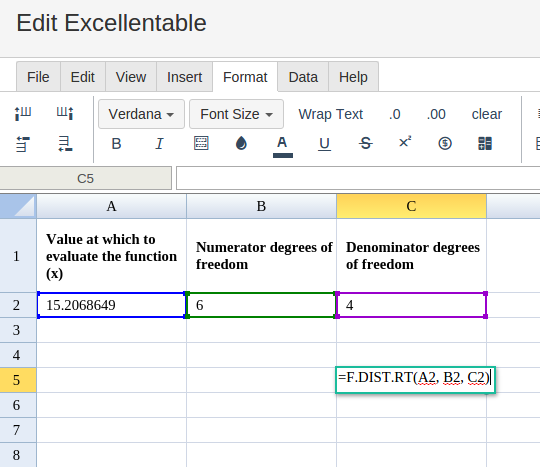
Then type in the F.DIST.RT formula in the area you would like to display the outcome:
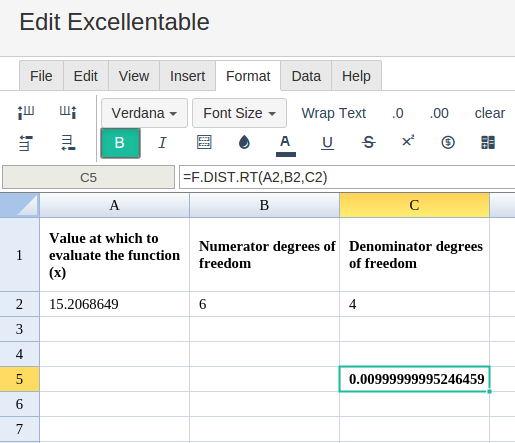
By adding the values you would like to calculate the F.DIST.RT formula for, Excellentable will generate the outcome: