LINESPARKLINE
The LINESPARKLINE have the following options:
| Option | Description |
| Data | A range reference that represents sparkline data. For example: A1:C3. |
| DataOrientation | A number that represents the sparkline data orientation, 0 is vertical, 1 is horizontal. |
| DateAxisData | A range reference that represents sparkline date axis data. For example: D1:F3. This setting is optional. |
| DateAxisOrientation | A number that represents the sparkline date axis orientation, 0 is vertical, 1 is horizontal. This setting is optional. |
| Setting | A string with JSON format. For example: "{axisColor:rgb(255,255,0),firstMarkerColor:brown,highMarkerColor:red,lastMarkerColor:blue,lowMarkerColor:green,markersColor:purple,negativeColor:yellowgreen, seriesColor:pink,displayXAxis:true,showFirst:true,showHigh:true,showLast:true,showLow:true,showNegative:true,showMarkers:true,lineWeight:3,displayHidden:false, displayEmptyCellsAs:1,rightToLeft:false,minAxisType:1,maxAxisType:1,manualMax:5,manualMin:-3}". This setting is optional. |
The following table lists the JSON format string and the equivalent sparkline setting method or property.
| Json Property | SparklineSetting Method or Property |
| AXISCOLOR | axisColor() |
| FIRSTMARKERCOLOR | firstMarkerColor() |
| HIGHMARKERCOLOR | highMarkerColor() |
| LASTMARKERCOLOR | lastMarkerColor() |
| LOWMARKERCOLOR | lowMarkerColor() |
| MARKERSCOLOR | markersColor() |
| NEGATIVECOLOR | negativeColor() |
| SERIESCOLOR | seriesColor() |
| DISPLAYEMPTYCELLSAS | displayEmptyCellsAs |
| RIGHTTOLEFT | rightToLeft |
| DISPLAYHIDDEN | displayHidden |
| DISPLAYXAXIS | displayXAxis |
| SHOWFIRST | showFirst() |
| SHOWHIGH | showHigh() |
| SHOWLAST | showLast() |
| SHOWLOW | showLow() |
| SHOWNEGATIVE | showNegative() |
| SHOWMARKERS | showMarkers() |
| MANUALMAX | manualMax |
| MANUALMIN | manualMin |
| MAXAXISTYPE | maxAxisType |
| MINAXISTYPE | minAxisType |
| LINEWEIGHT | lineWeight |
Sample Usage
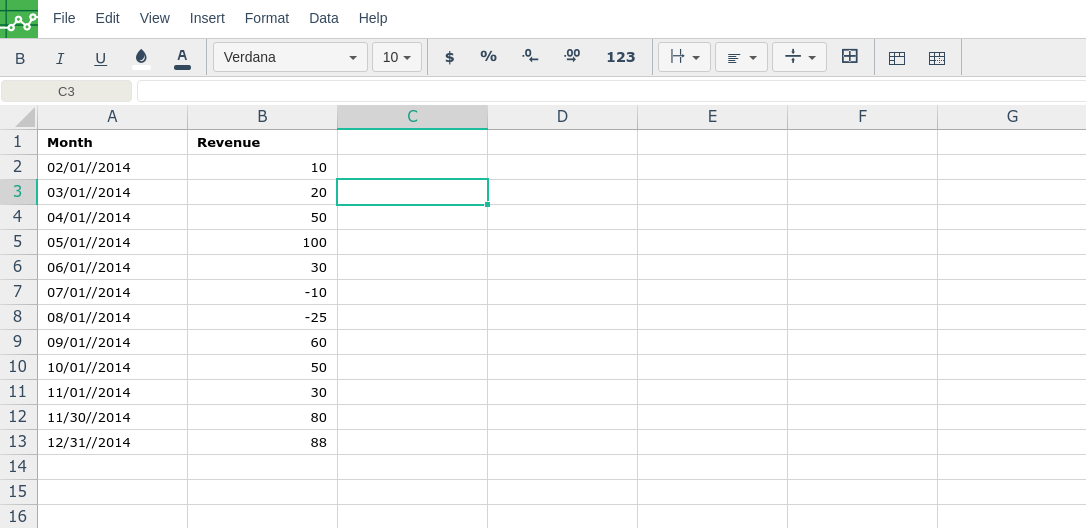
In order to use the LINESPARKLINE formula, start with your edited Excellentable:
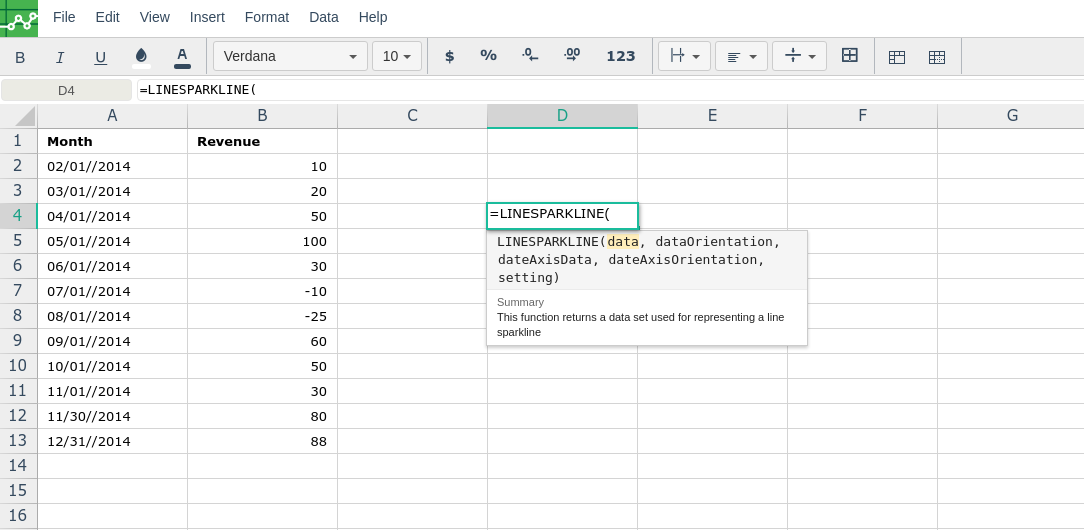
Then type in the LINESPARKLINE formula in the area you would like to display the outcome:
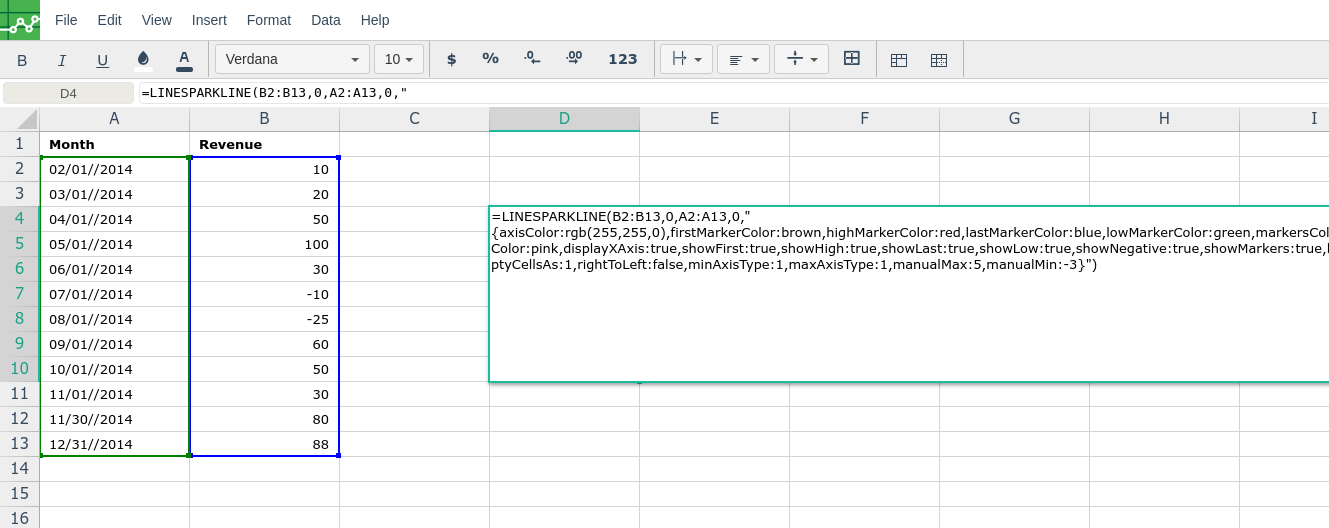
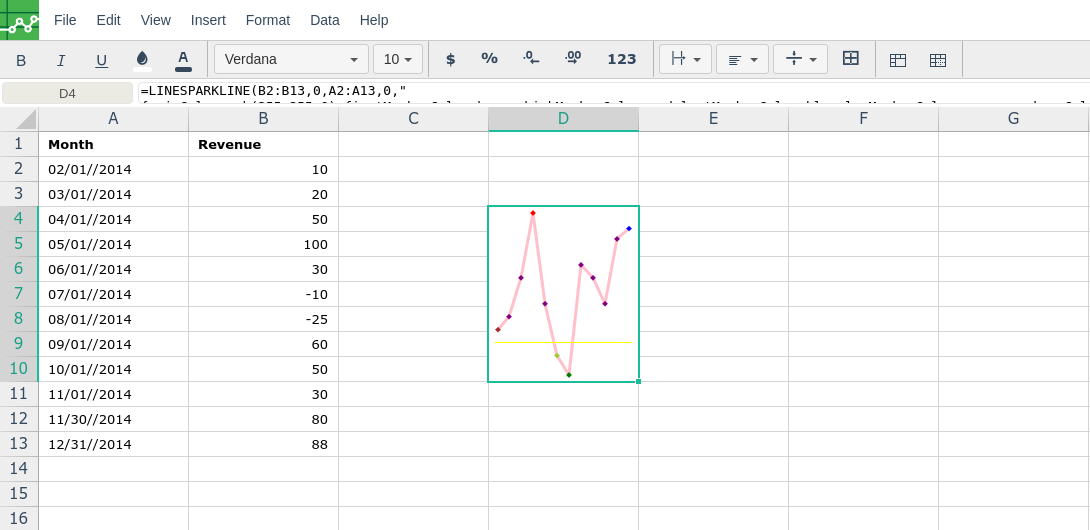
By adding the values you would like to calculate the LINESPARKLINE formula for, Excellentable will generate the outcome:
Error rendering macro 'excellentable' : Page loading timed out