LINEST
Definition
Given partial data about a linear trend, calculates various parameters about the ideal linear trend using the least-squares method.
Sample Usage
Syntax
LINEST(known_data_y, [known_data_x], [calculate_b], [verbose])
known_data_y- The array or range containing dependent (y) values that are already known, used to curve fit an ideal linear trend.If
known_data_yis a two-dimensional array or range,known_data_xmust have the same dimensions or be omitted.If
known_data_yis a one-dimensional array or range,known_data_xmay represent multiple independent variables in a two-dimensional array or range. I.e. ifknown_data_yis a single row, each row inknown_data_xis interpreted as a separated independent value, and analogously ifknown_data_yis a single column.
known_data_x- [ OPTIONAL -{1,2,3,...}with same length asknown_data_yby default ] - The values of the independent variable(s) corresponding withknown_data_y.- If
known_data_yis a one-dimensional array or range,known_data_xmay represent multiple independent variables in a two-dimensional array or range. I.e. ifknown_data_yis a single row, each row inknown_data_xis interpreted as a separated independent value, and analogously ifknown_data_yis a single column.
- If
calculate_b- [ OPTIONAL -TRUEby default ] - Given a linear form ofy = m*x+b, calculates the y-intercept (b) ifTRUE. Otherwise, forcesbto be0and only calculates themvalues ifFALSE, i.e. forces the curve fit to pass through the origin.verbose- [ OPTIONAL -FALSEby default ] - A flag specifying whether to return additional regression statistics or only the linear coefficients and the y-intercept (default).If
verboseisTRUE, in addition to the set of linear coefficients for each independent variable and they-intercept,LINESTreturnsThe standard error for each coefficient and the intercept,
The coefficient of determination (between 0 and 1, where 1 indicates perfect correlation),
Standard error for the dependent variable values,
The F statistic, or F-observed value indicating whether the observed relationship between dependent and independent variables is random rather than linear,
The degrees of freedom, useful in looking up F statistic values in a reference table to estimate a confidence level,
The regression sum of squares, and
The residual sum of squares.
See Also
TREND: Given partial data about a linear trend, fits an ideal linear trend using the least squares method and/or predicts further values.
LOGEST: Given partial data about an exponential growth curve, calculates various parameters about the best fit ideal exponential growth curve.
GROWTH: Given partial data about an exponential growth trend, fits an ideal exponential growth trend and/or predicts further values.
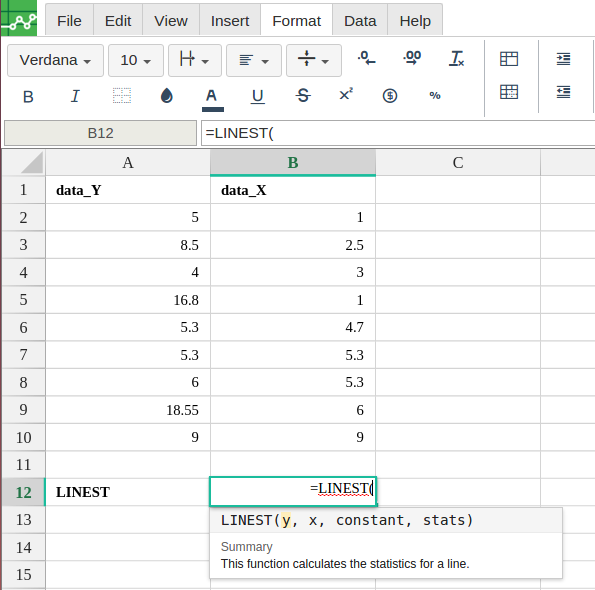
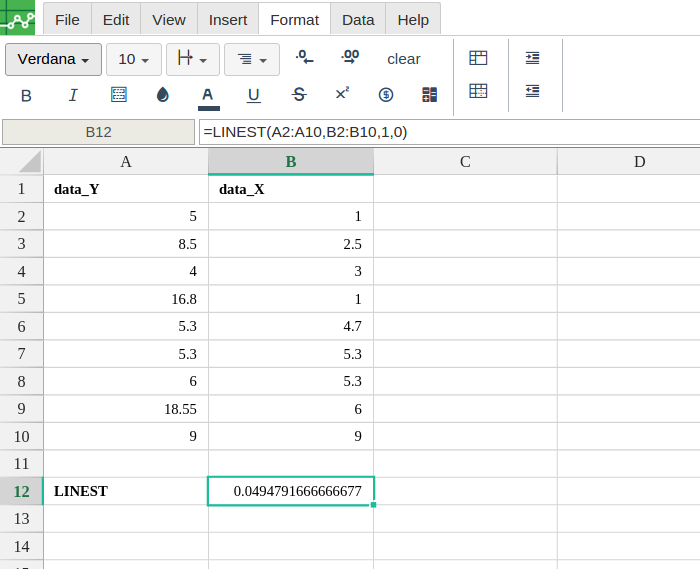
In order to use the LINEST formula, start with your edited Excellentable: