PERCENTRANK
Definition of PERCENTRANK
Returns the percentage rank (percentile) of a specified value in a dataset.
Sample Usage
PERCENTRANK(A2:A100,A2)
PERCENTRANK(A2:A100,1,7)
Syntax
PERCENTRANK(data, value, [significant_digits])
data- The array or range containing the dataset to consider.value- The value whose percentage rank will be determined.significant_digits- [ OPTIONAL -3by default ] - The number of significant figures to use in the calculation.
Notes
- If
datadoes not containvaluein any cell or element,PERCENTRANKwill return the#N/Aerror. - If a number less than or equal to 0 is used for
significant_digitsthen this value will be ignored and the default number of significant digits will be used instead.
See Also
PERCENTRANK.INC: Returns the percentage rank (percentile) from 0 to 1 inclusive of a specified value in a dataset.
PERCENTRANK.EXC: Returns the percentage rank (percentile) from 0 to 1 exclusive of a specified value in a dataset.
SMALL: Returns the nth smallest element from a data set, where n is user-defined.
RANK: Returns the rank of a specified value in a dataset.
QUARTILE: Returns a value nearest to a specified quartile of a dataset.
PERCENTILE: Returns the value at a given percentile of a dataset.
MINA: Returns the minimum numeric value in a dataset.
MIN: Returns the minimum value in a numeric dataset.
MEDIAN: Returns the median value in a numeric dataset.
MAXA: Returns the maximum numeric value in a dataset.
MAX: Returns the maximum value in a numeric dataset.
LARGE: Returns the nth largest element from a data set, where n is user-defined.
AVERAGEA: Returns the numerical average value in a dataset.
AVERAGE: Returns the numerical average value in a dataset, ignoring text.
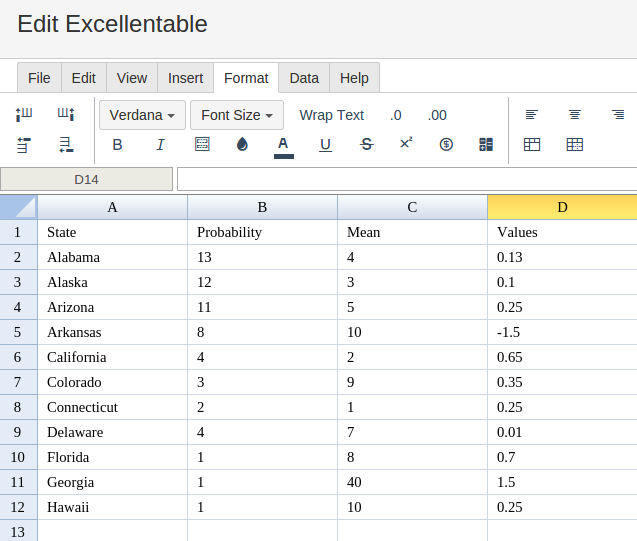
In order to use the PERCENTRANK formula, start with your edited Excellentable
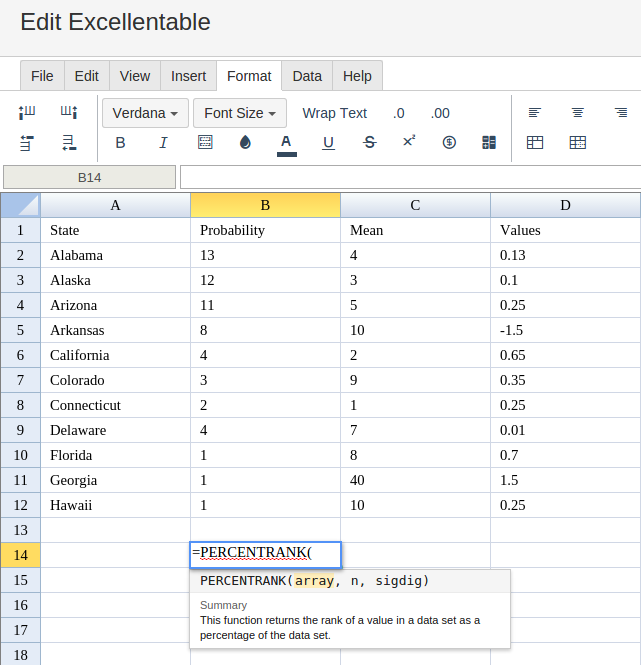
Then type in the PERCENTRANK Formula in area you would like to display the outcome:
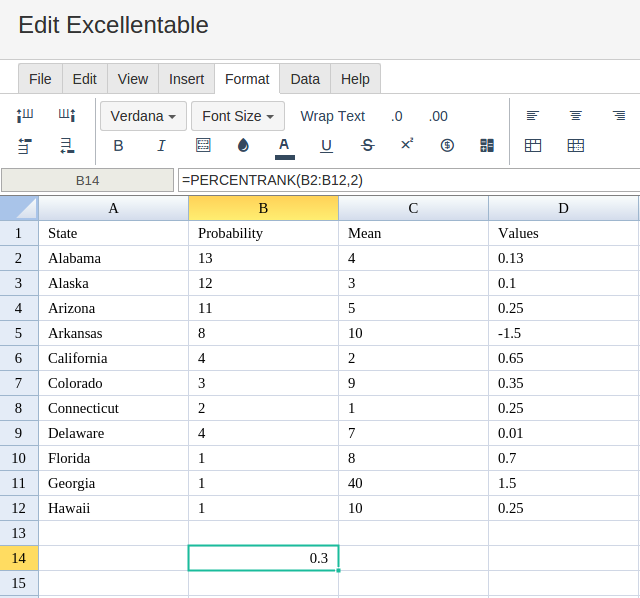
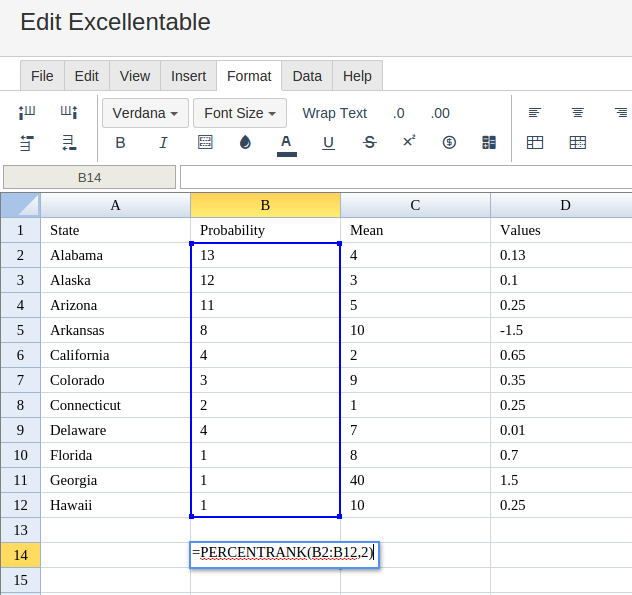
Type in the complete PERCENTRANK formula for a cell as shown below:
Excellentable will generate the outcome when hitting enter.