RSQ
Definition
Calculates the square of r, the Pearson product-moment correlation coefficient of a dataset.
Sample Usage
RSQ(A2:A100,B2:B100)
Syntax
RSQ(data_y, data_x)
data_y- The range representing the array or matrix of dependent data.data_x- The range representing the array or matrix of independent data.
Notes
- Any text encountered in the
valuearguments will be ignored.
See Also
STEYX: Calculates the standard error of the predicted y-value for each x in the regression of a dataset.
SLOPE: Calculates the slope of the line resulting from linear regression of a dataset.
PEARSON: Calculates r, the Pearson product-moment correlation coefficient of a dataset.
INTERCEPT: Calculates the y-value at which the line resulting from linear regression of a dataset will intersect the y-axis (x=0).
FORECAST: Calculates the expected y-value for a specified x based on a linear regression of a dataset.
COVAR: Calculates the covariance of a dataset.
CORREL: Calculates r, the Pearson product-moment correlation coefficient of a dataset.
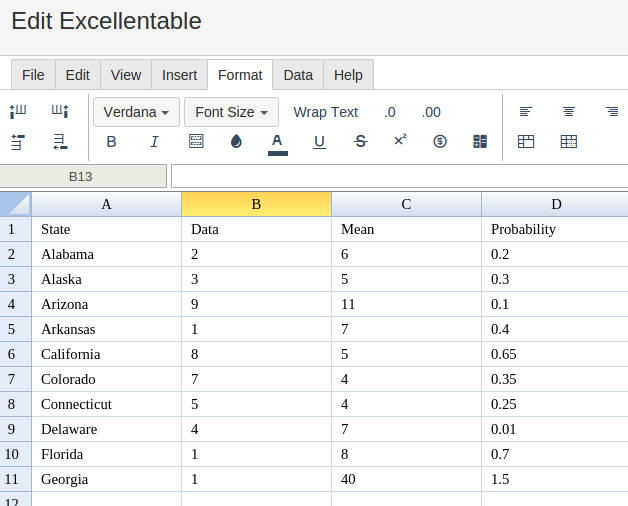
In order to use the RSQ formula, start with your edited Excellentable
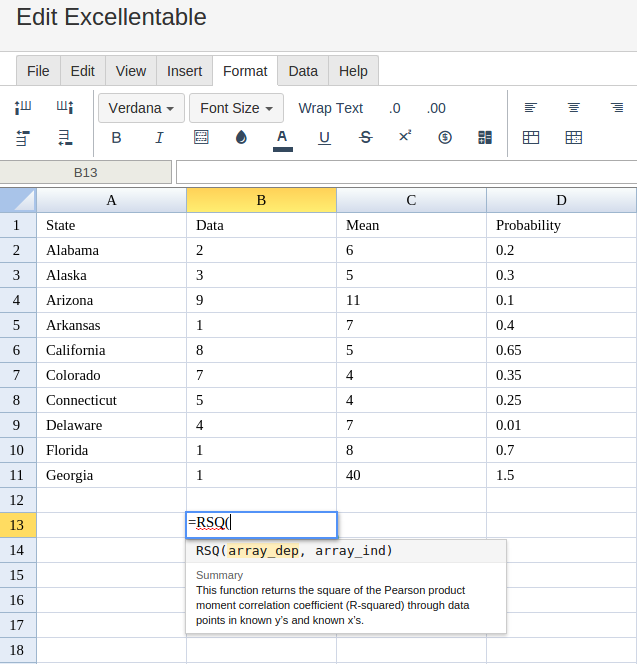
Then type in the RSQ Formula in area you would like to display the outcome:
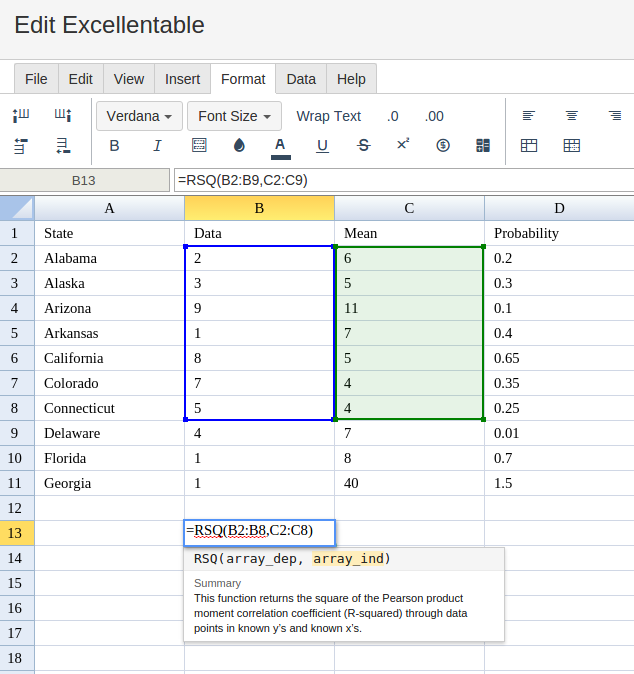
Type in the complete RSQ formula for a cell as shown below:
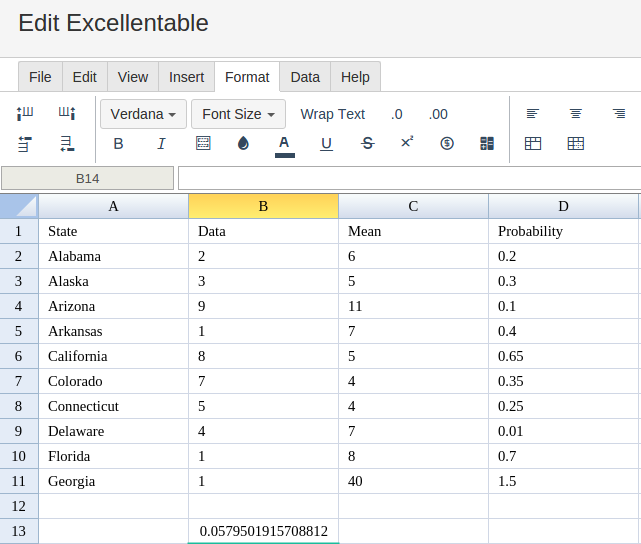
Excellentable will generate the outcome when hitting enter.