SCATTERSPARKLINE
The scatter sparkline formula has the following options:
| Option | Description |
| Points1 | The first xy data series. If the row count is greater than or equal to the column count, use data from the first two columns. The first column contains x-values and the second column contains y-values. If the row count is less than the column count, use data from the first two rows. The first row contains x-values and the second row contains y-values. |
| Points2 | The second xy data series. If the row count is greater than or equal to the column count, use data from the first two columns. The first column contains x-values and the second column contains y-values. If the row count is less than the column count, use data from the first two rows. The first row contains x-values and the second row contains y-values. |
| MinX | The x-minimum limit of both series, each series has its own value if it is omitted. |
| MaxX | The x-maximum limit of both series, each series has its own value if it is omitted. |
| MinY | The y-minimum limit of both series, each series has its own value if it is omitted. |
| MaxY | The y-maximum limit of both series, each series has its own value if it is omitted. |
| HLine | The horizontal axis position, there is no line if it is omitted. |
| VLine | The vertical axis position, there is no line if it is omitted. |
| XMinZone | The x-minimum value of the gray zone, there is no grey zone if any of these four parameters are omitted. |
| XMaxZone | The x-maximum value of the gray zone, there is no grey zone if any of these four parameters are omitted. |
| YMinZone | The y-minimum value of the gray zone, there is no grey zone if any of these four parameters are omitted. |
| YMaxZone | The y-maximum value of the gray zone, there is no grey zone if any of these four parameters are omitted. |
| Tags | If this option is true, mark the point at which the y-value is the maximum of the first series as "#0000FF", and mark the point at which the y-value is the minimum of the first series as "#CB0000". This option is false if it is omitted. |
| DrawSymbol | If this option is true, draw each point as a symbol. The symbol of the first series is a circle, and the symbol of the second series is a square. This option is true if it is omitted. |
| DrawLines | If this option is true, connect each point with a line by sequence in each series. This option is false if it is omitted. |
| Color1 | The color string of the first point series. The value is "#969696" if it is omitted. |
| Color2 | The color string of the second point series. The value is "#CB0000" if it is omitted. |
| Dash | If this option is true, the line is a dashed line; otherwise, the line is a full line. This option is false if it is omitted. |
Sample Usage
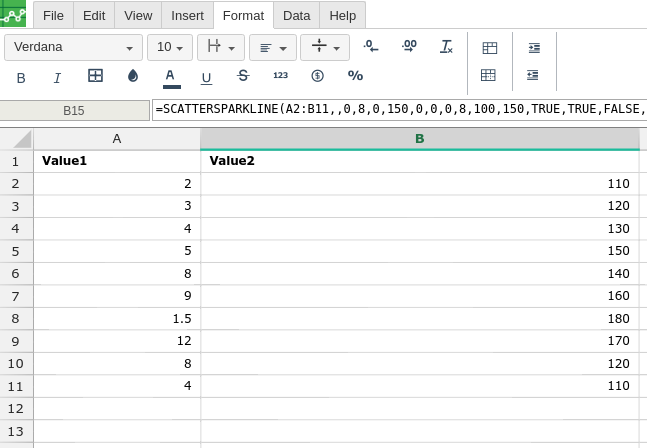
In order to use the SCATTERSPARKLINE formula, start with your edited Excellentable:
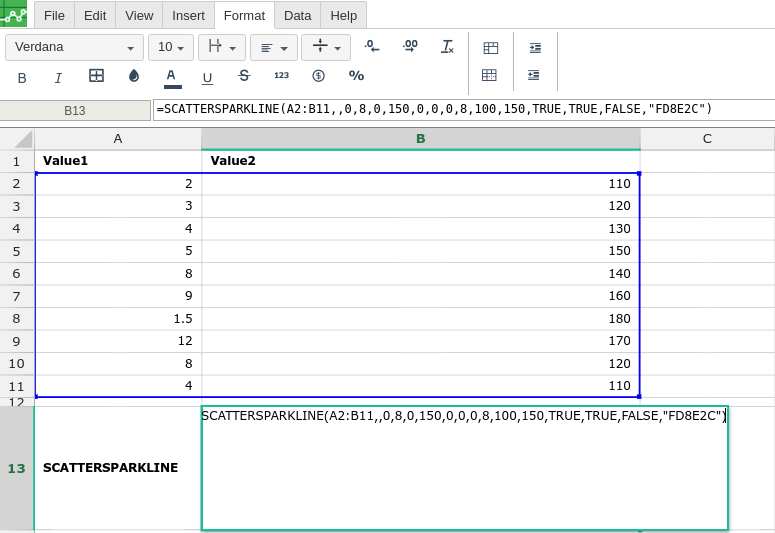
Then type in the SCATTERSPARKLINE formula in the area you would like to display the outcome:
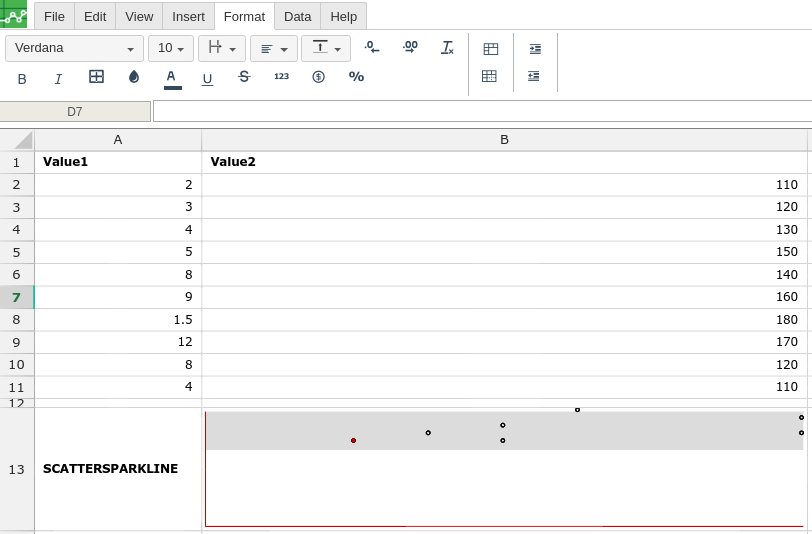
By adding the values you would like to calculate the SCATTERSPARKLINE formula for, Excellentable will generate the outcome:
Error rendering macro 'excellentable' : Page loading timed out