SKEW
Definition
Calculates the skewness of a dataset, which describes the symmetry of that dataset about the mean.
Sample Usage
SKEW(1,2,3,4,5,6,7,8,9,10)
SKEW(A2:A100)
Syntax
SKEW(value1, [value2, ...])
value1- The first value or range of the dataset.value2, ...- Additional values or ranges to include in the dataset.
Notes
Although
SKEWis specified as taking a maximum of 30 arguments, Google Sheets supports an arbitrary number of arguments for this function.If the total number of values supplied as
valuearguments is not at least two,SKEWwill return the#NUM!error.Any text encountered in the
valuearguments will be ignored.Positive skewness indicates a longer tail extending in the positive direction, to the right of the mean, while negative skewness indicates a longer tail in the negative direction, to the left. Skewness nearer to zero indicates more symmetrical distributions.
See Also
VARPA: Calculates the variance based on an entire population, setting text to the value `0`.
VARP: Calculates the variance based on an entire population.
VARA: Calculates the variance based on a sample, setting text to the value `0`.
VAR: Calculates the variance based on a sample.
STDEVPA: Calculates the standard deviation based on an entire population, setting text to the value `0`.
STDEVP: Calculates the standard deviation based on an entire population.
STDEVA: Calculates the standard deviation based on a sample, setting text to the value `0`.
KURT: Calculates the kurtosis of a dataset, which describes the shape, and in particular the "peakedness" of that dataset.
DVARP: Returns the variance of an entire population selected from a database table-like array or range using a SQL-like query.
DVAR: Returns the variance of a population sample selected from a database table-like array or range using a SQL-like query.
DSTDEVP: Returns the standard deviation of an entire population selected from a database table-like array or range using a SQL-like query.
DSTDEV: Returns the standard deviation of a population sample selected from a database table-like array or range using a SQL-like query.
DEVSQ: Calculates the sum of squares of deviations based on a sample.
AVEDEV: Calculates the average of the magnitudes of deviations of data from a dataset's mean.
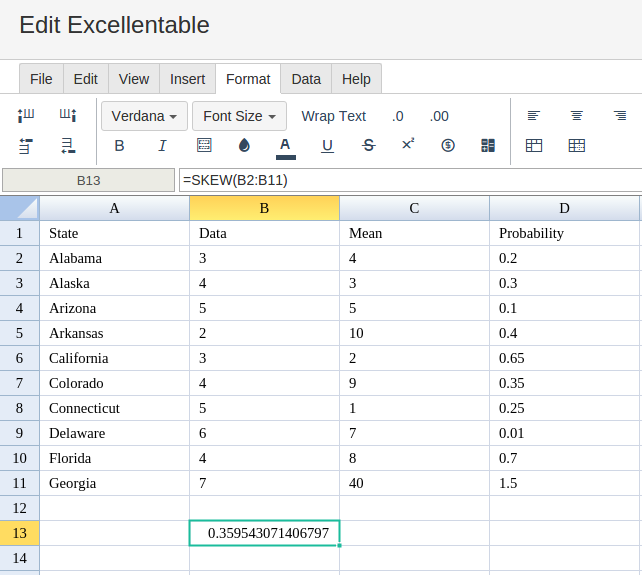
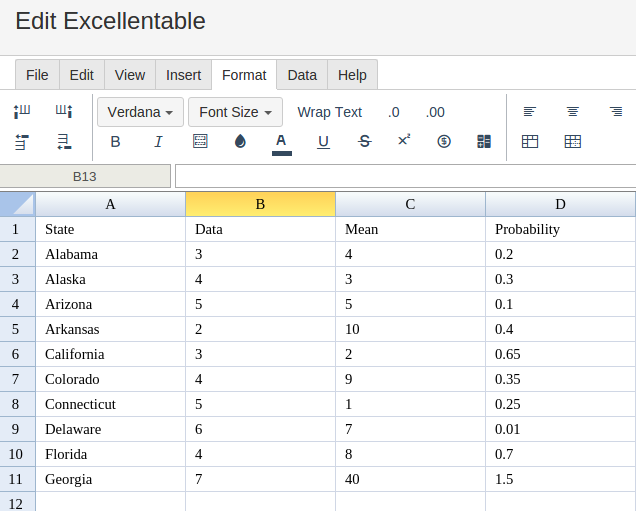
In order to use the SKEW formula, start with your edited Excellentable
Then type in the SKEW Formula in area you would like to display the outcome:
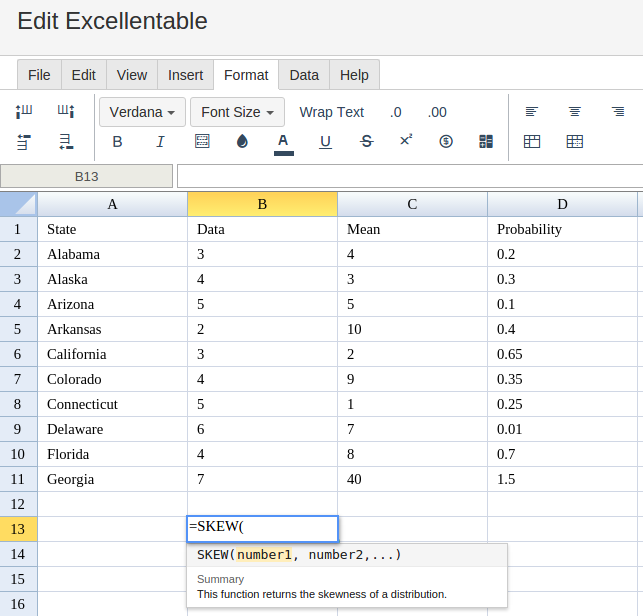
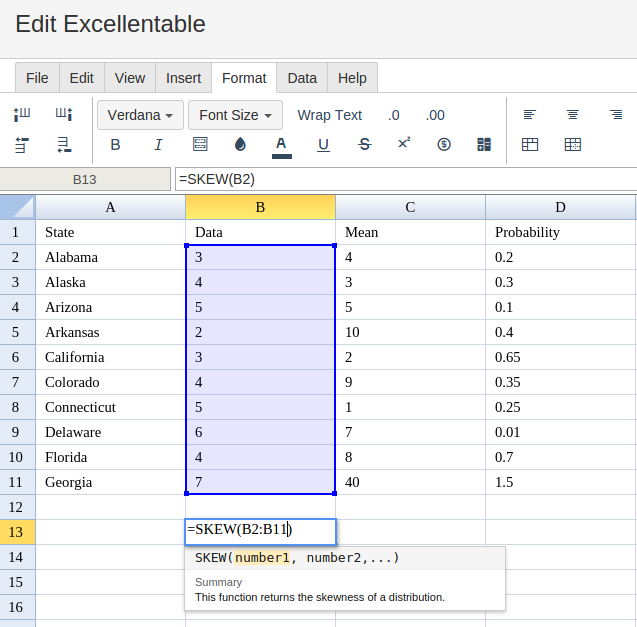
Type in the complete SKEW formula for a cell as shown below:
Excellentable will generate the outcome when hitting enter.