SLOPE
Definition
Calculates the slope of the line resulting from linear regression of a dataset.
Sample Usage
SLOPE(A2:A100,B2:B100)
Syntax
SLOPE(data_y, data_x)
data_y- The range representing the array or matrix of dependent data.data_x- The range representing the array or matrix of independent data.
Notes
- Any text encountered in the
valuearguments will be ignored.
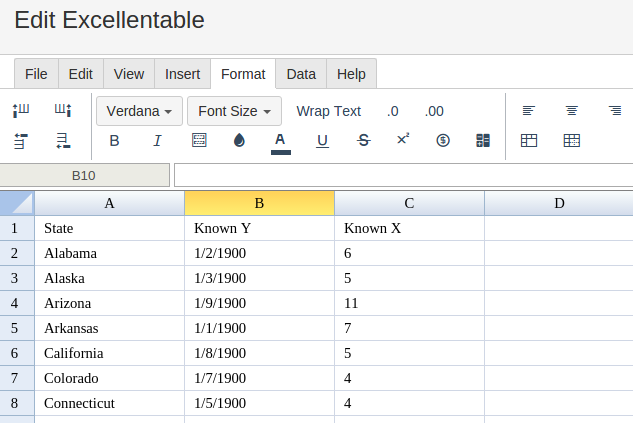
In order to use the SLOPE formula, start with your edited Excellentable
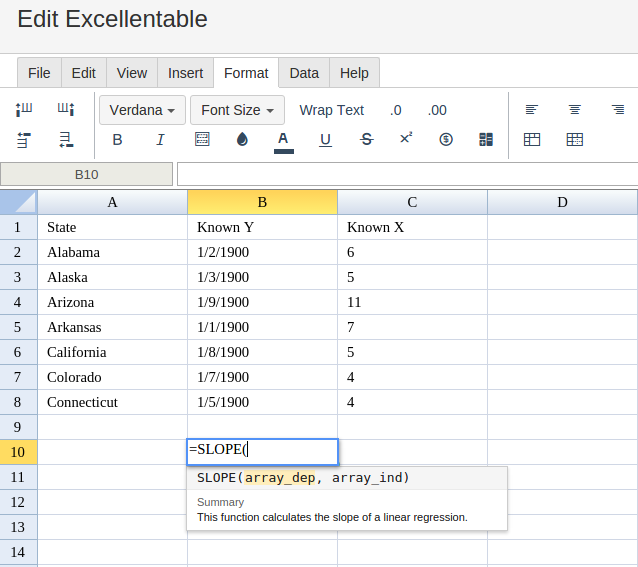
Then type in the SLOPE Formula in area you would like to display the outcome:
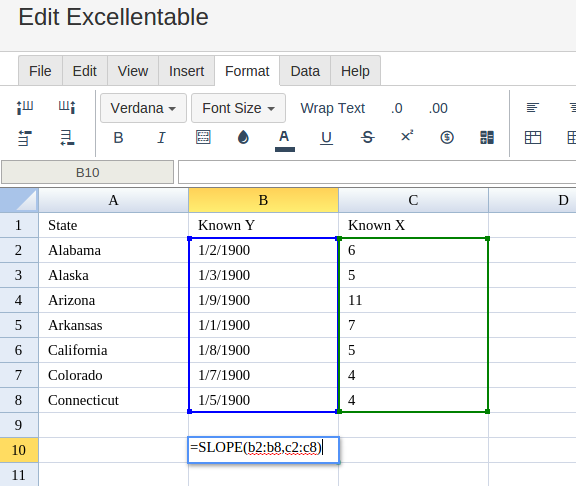
Type in the complete SLOPE formula for a cell as shown below:
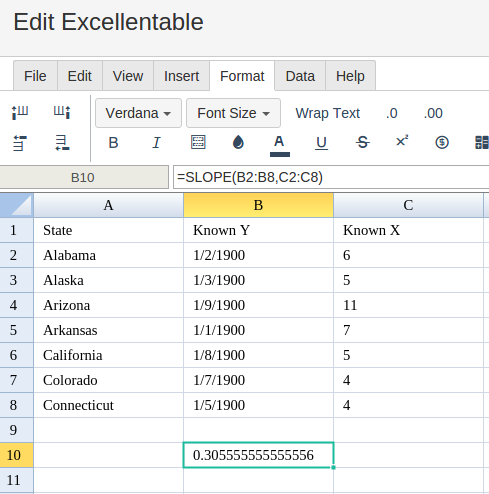
Excellentable will generate the outcome when hitting enter.
Error rendering macro 'excellentable' : Page loading timed out