Area Chart
What is an Area Chart?
Area charts can be used to plot change over time and draw attention to the total value across a trend. By showing the sum of the plotted values, an area chart also shows the relationship of parts to a whole.
What type of data is best used with Area Charts?
Data that's arranged in columns or rows on a worksheet can be plotted in an area chart.
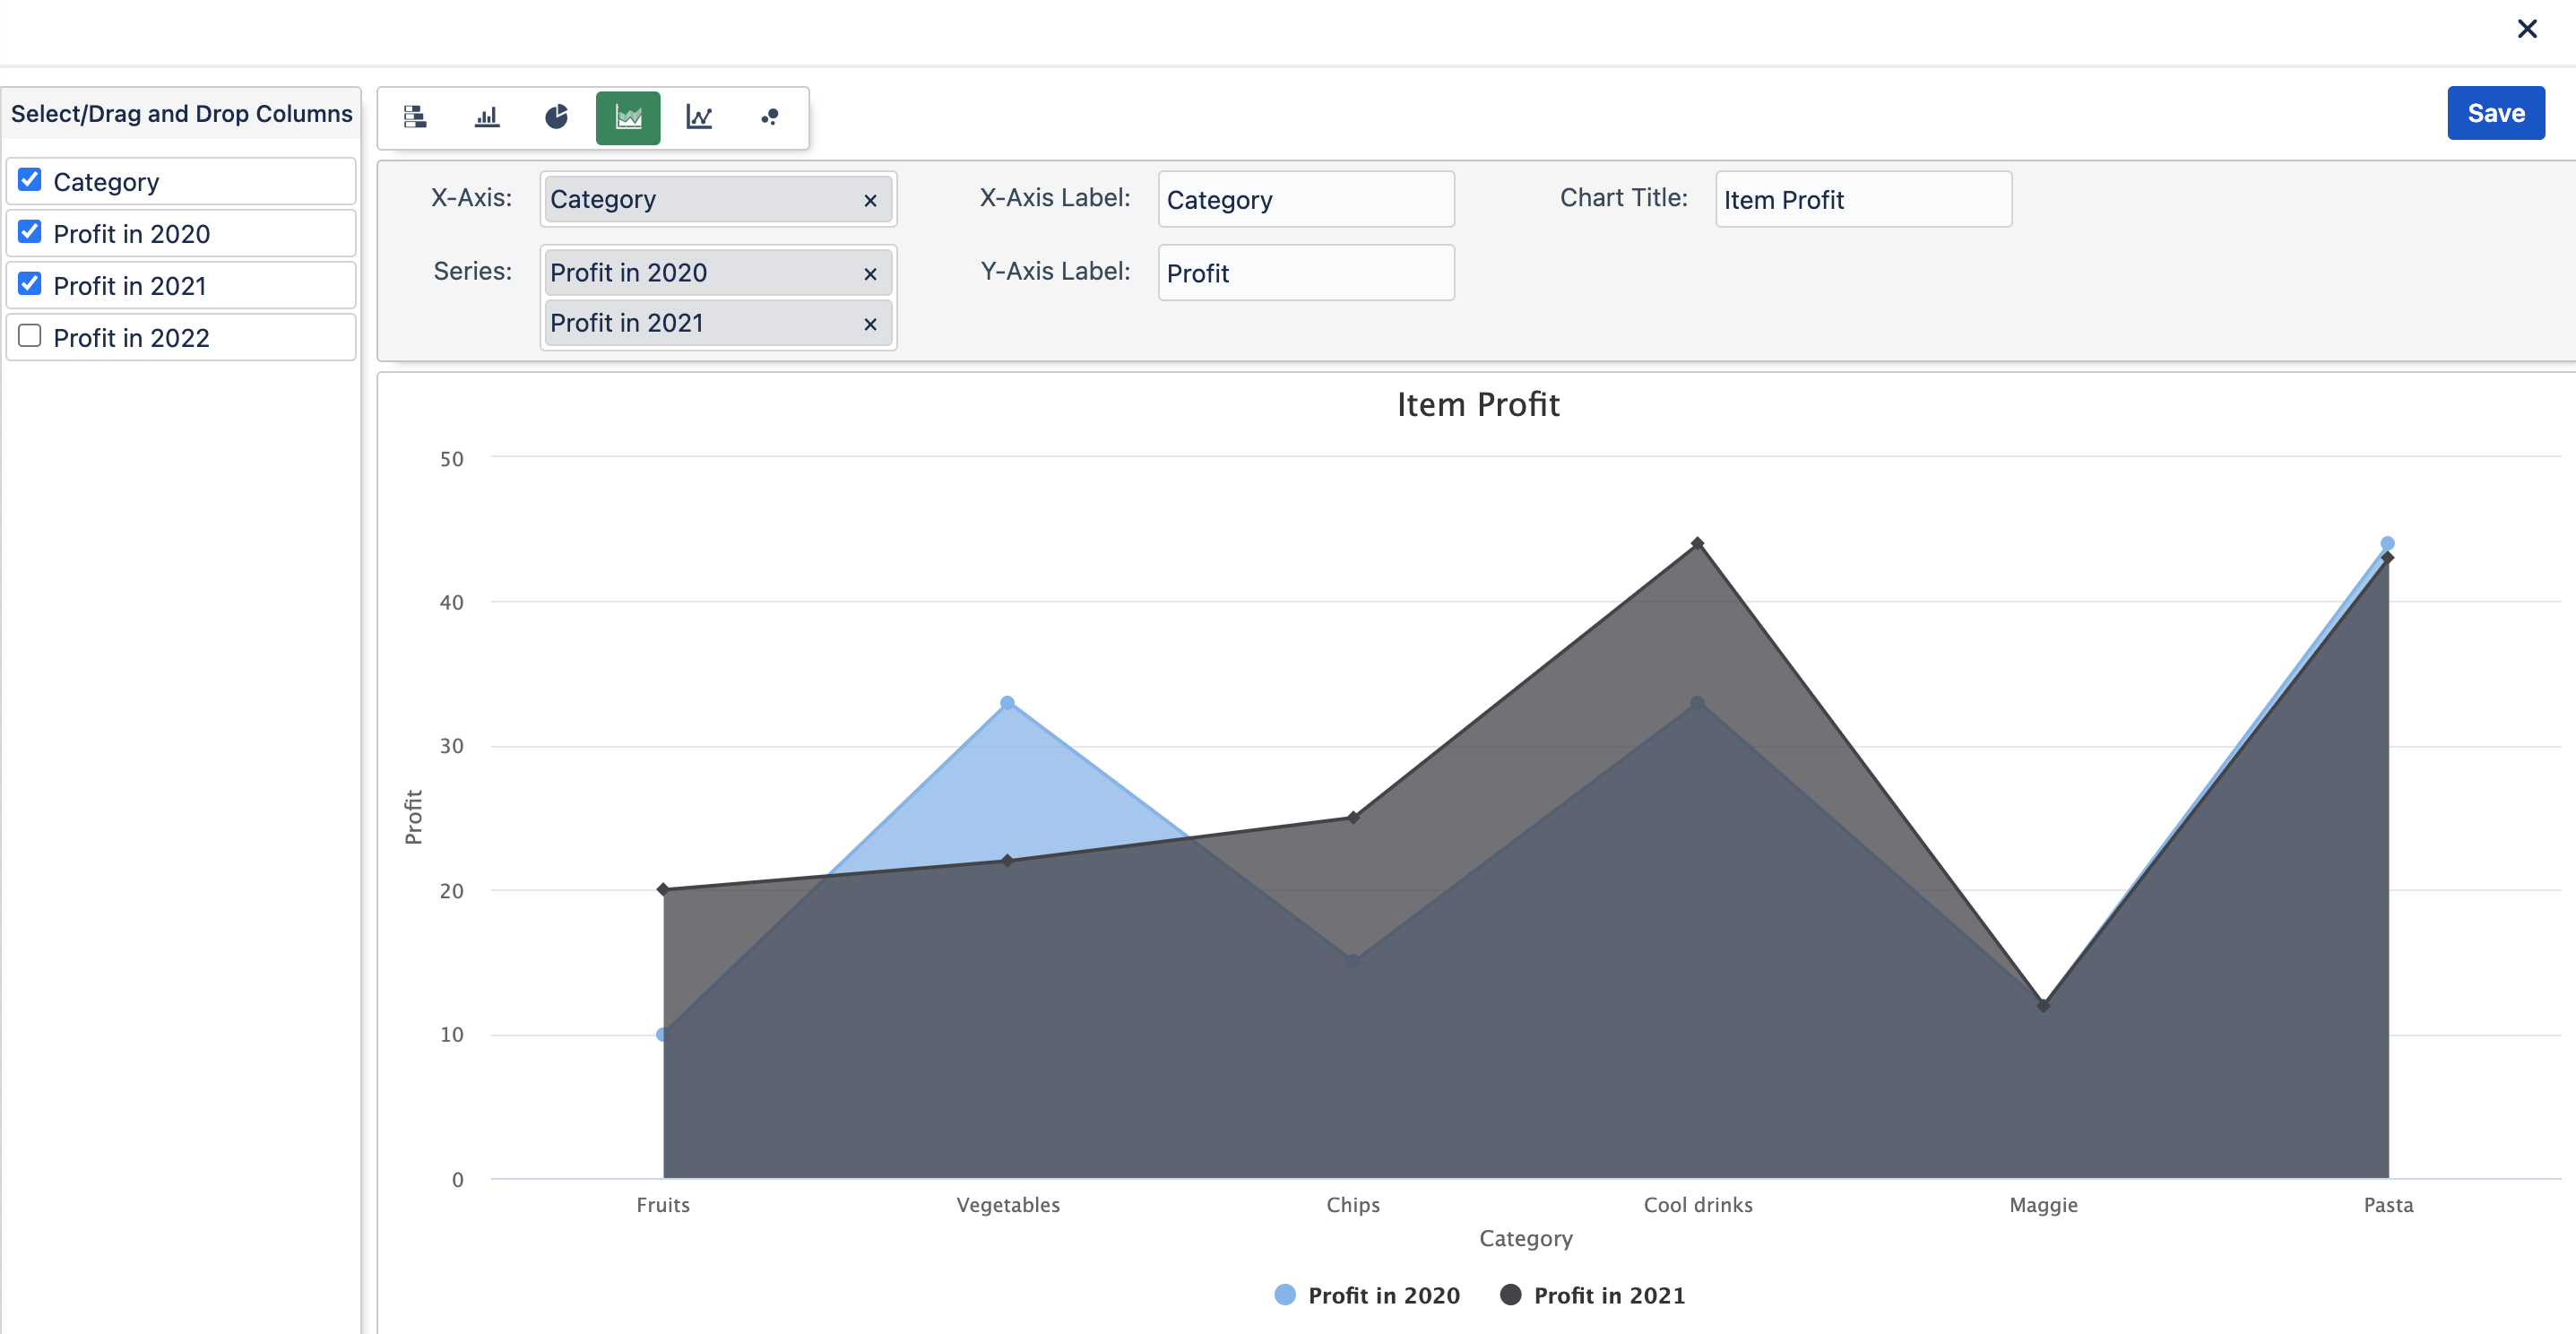
Example