Excellentable Charts
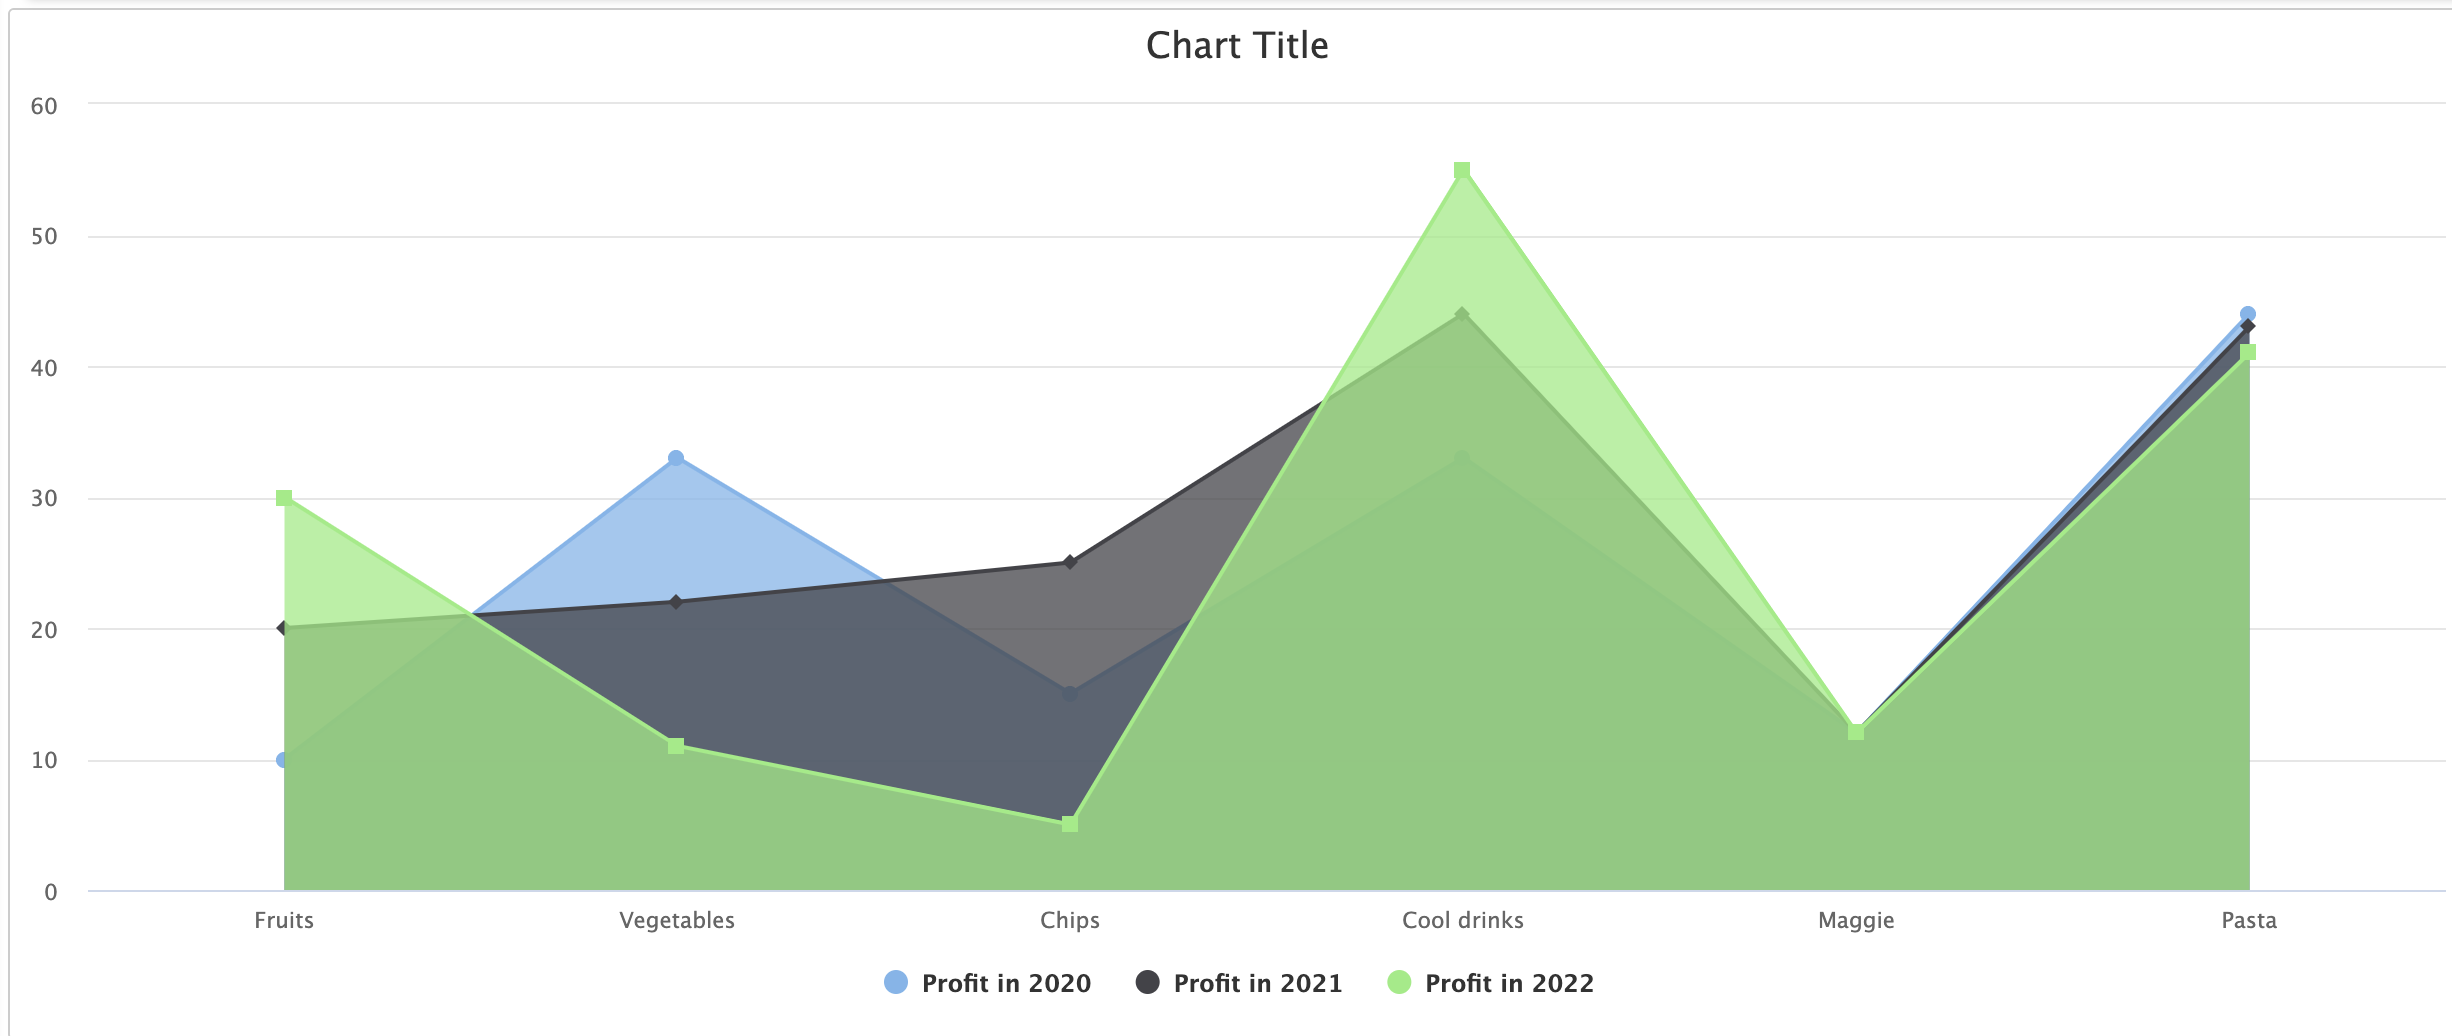
Charts are a powerful tool that allows users to visually display data in a variety of formats
It is a visual representation of data from a worksheet that can bring more understanding to the data than just looking at the numbers. Depending on the data you want to visualize, there are several different types of charts to give the users the best possible way to use Charts effectively.