Pie Chart
What is a Pie Chart?
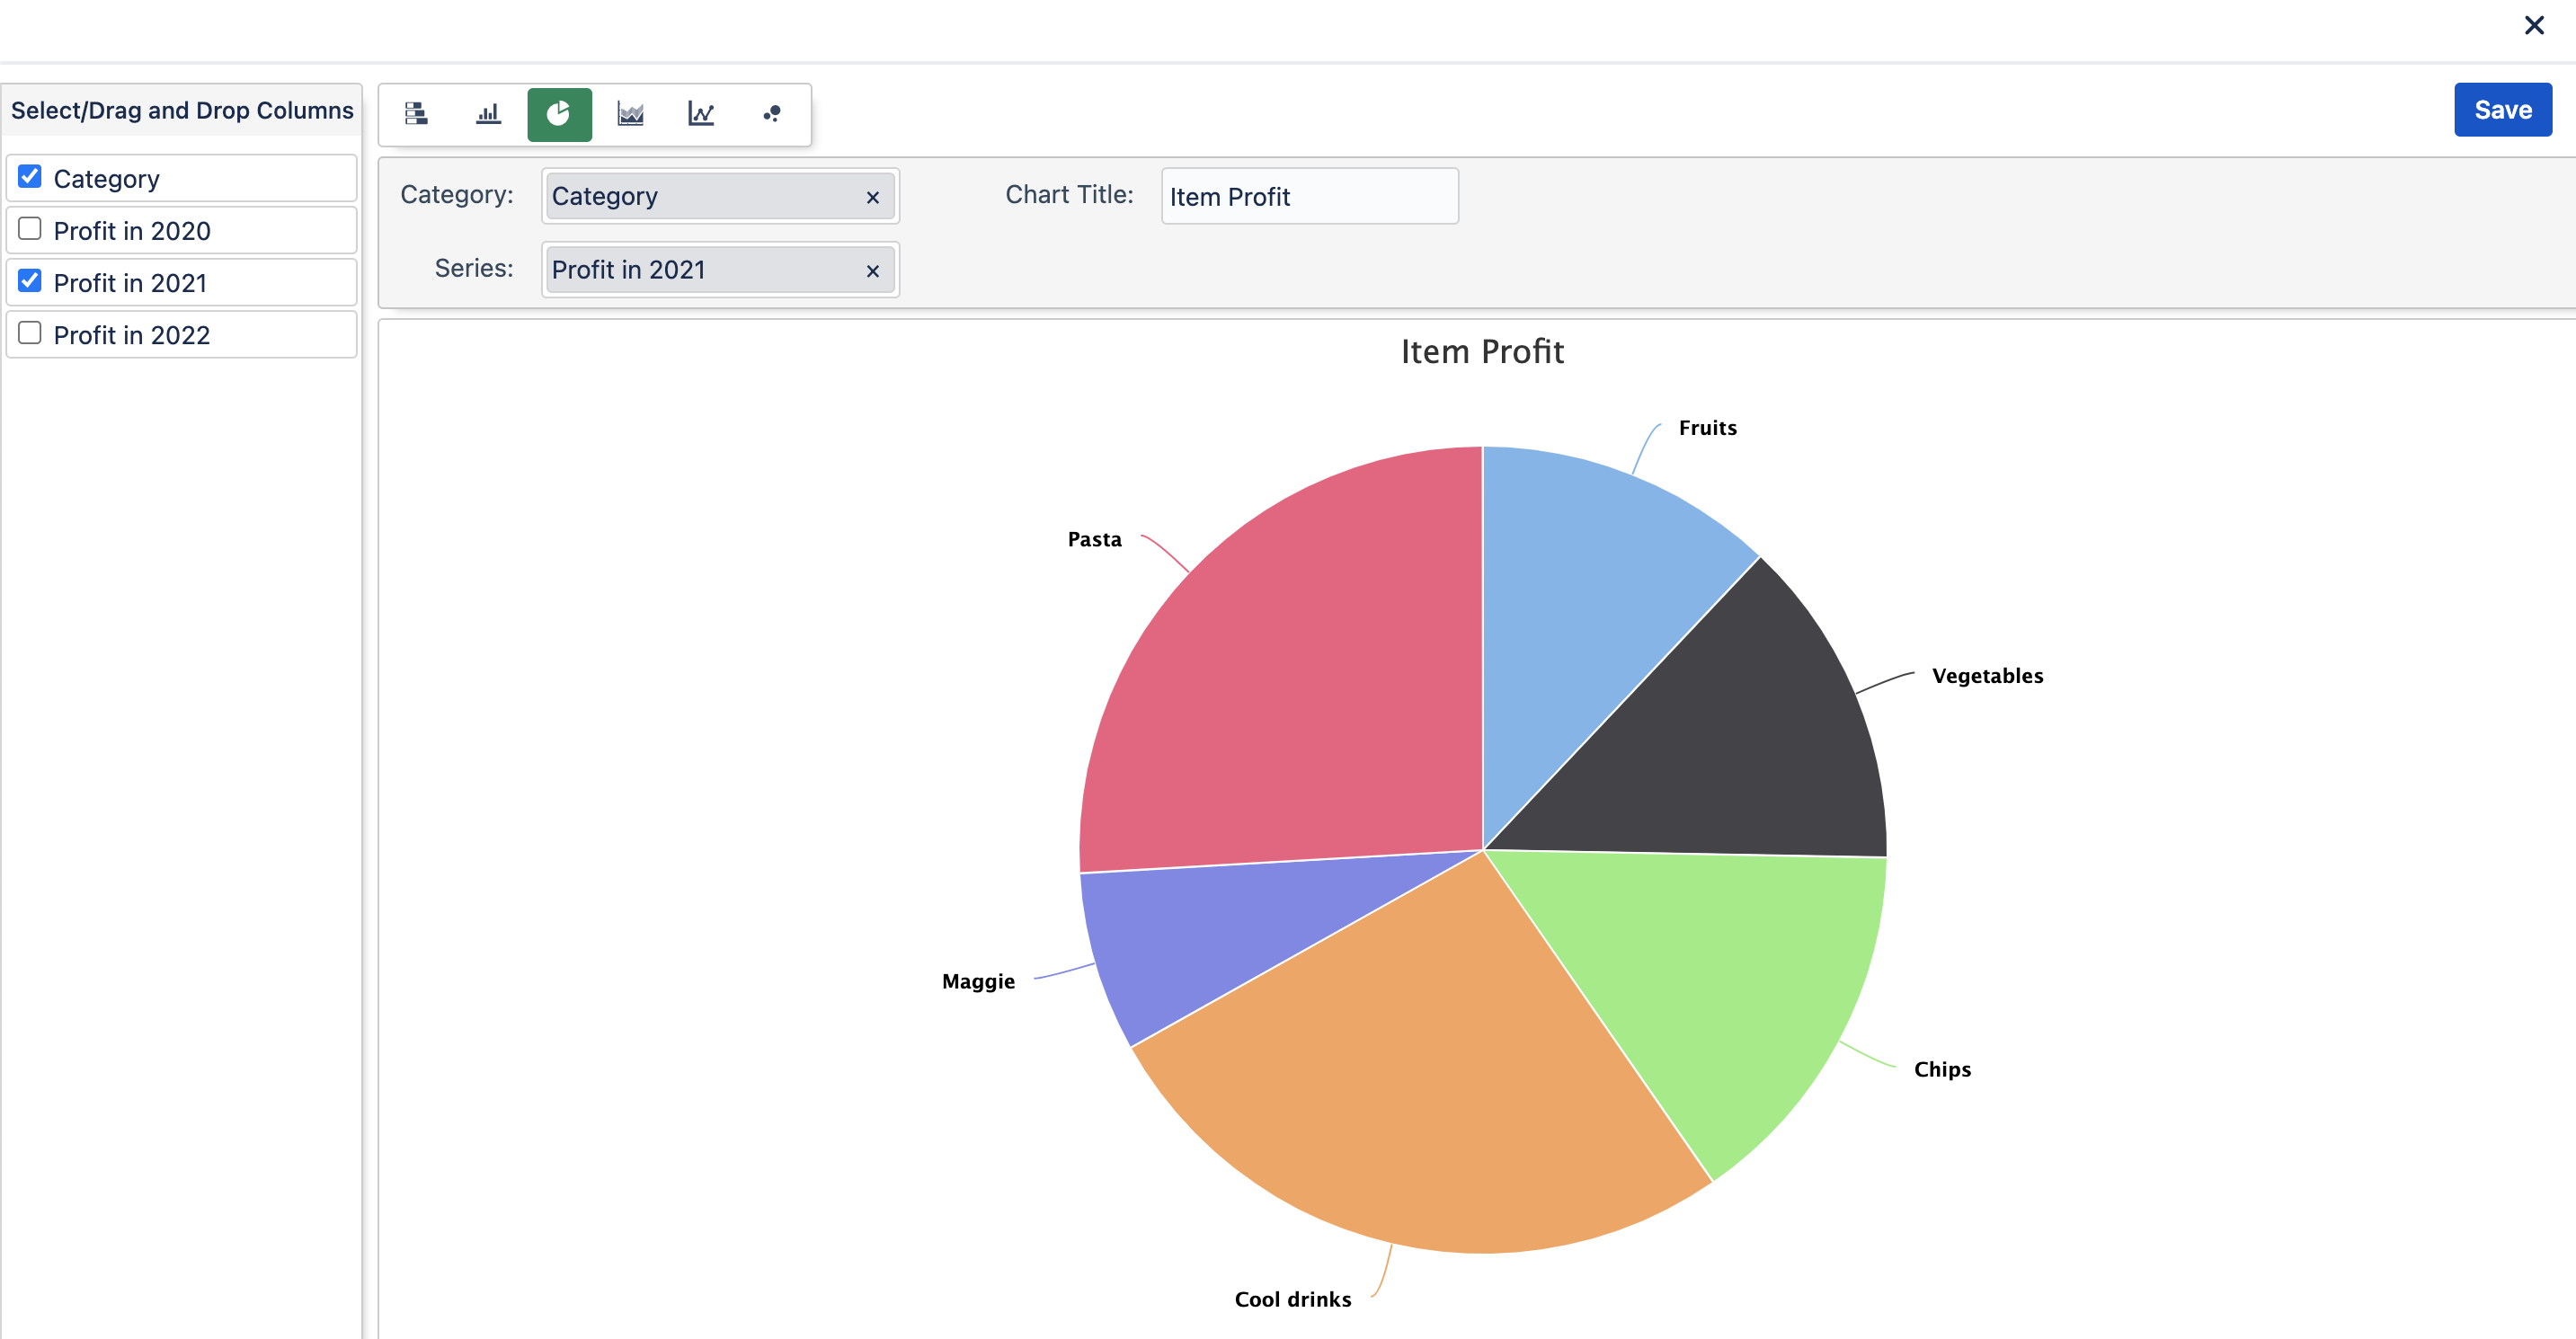
Pie charts show the size of items in one data series, proportional to the sum of the items. The data points in a pie chart are shown as a percentage of the whole pie.
What type of data is best used with a Pie Chart?
Data that's arranged in one column or row on a worksheet can be plotted in a pie chart.
Example