Column Chart
What is a Column Chart?
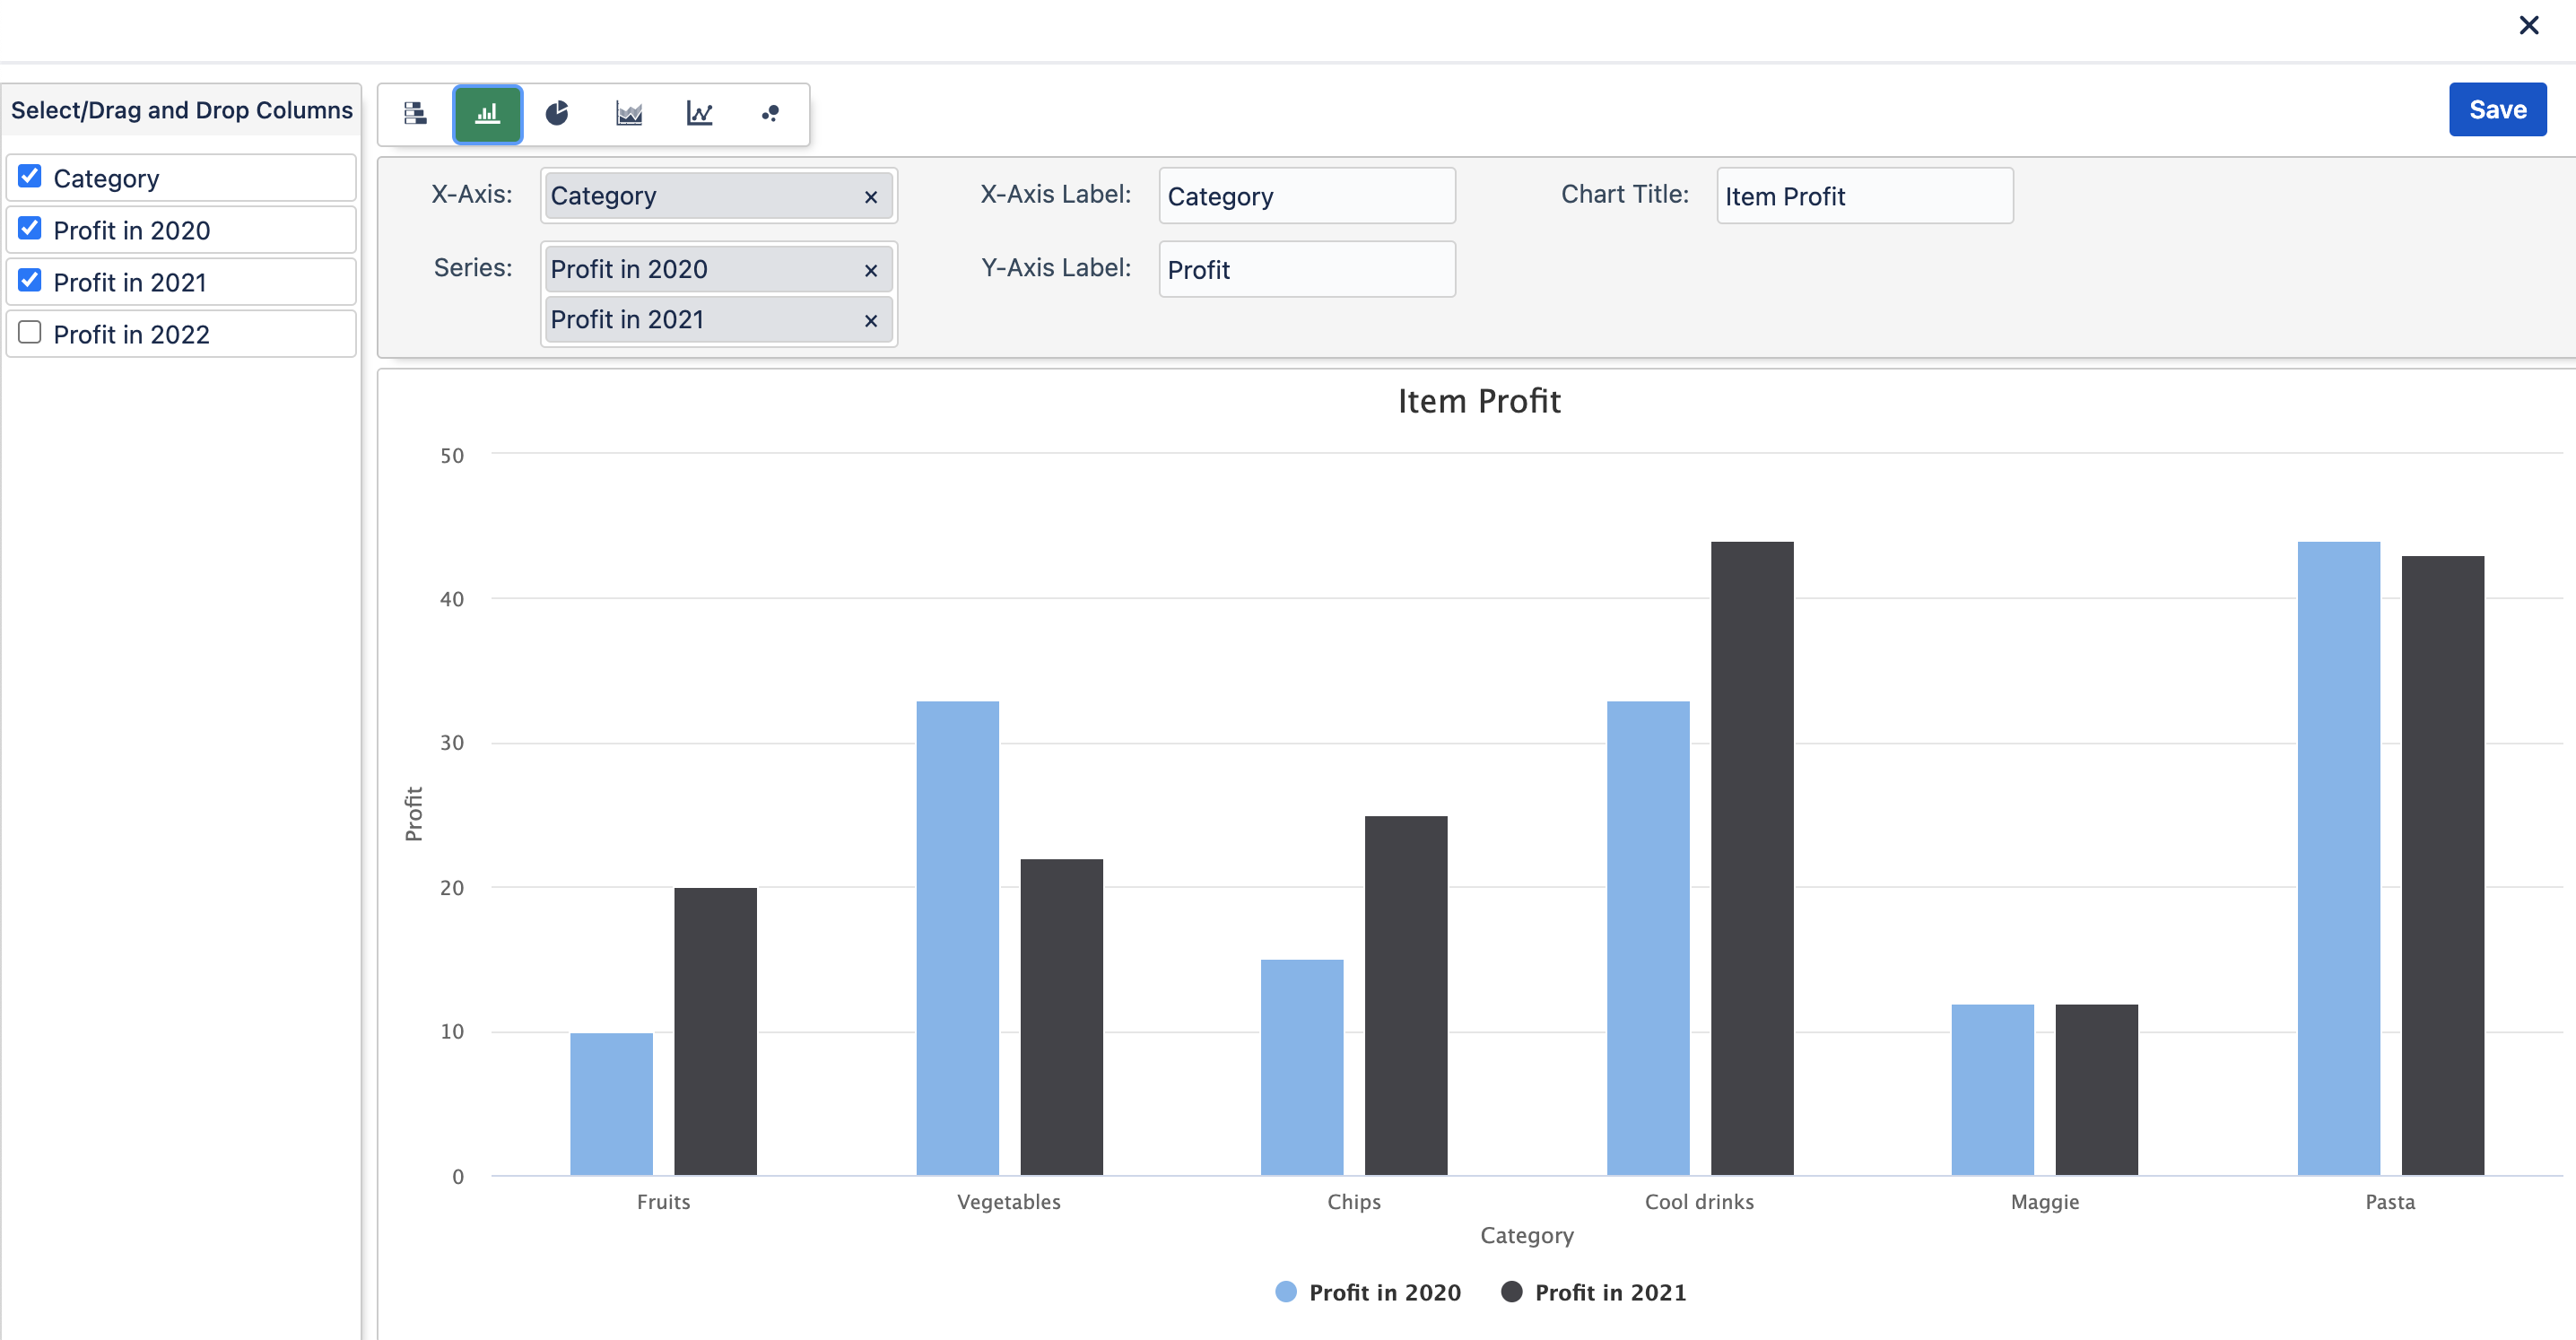
A column chart typically displays categories along the horizontal (category) axis and values along the vertical (value) axis, as shown in this chart:
What type of data is best used with a Column Chart?
Data that’s arranged in columns or rows on a worksheet can be plotted in a column chart.
Example