KURT
Definition/Description of Formula:
Calculates the kurtosis of a dataset, which describes the shape, and in particular the "peakedness" of that dataset.
Syntax:
KURT(value1, value2, ...)
value1- The first value or range of the dataset.value2, ...- Additional values or ranges to include in the dataset.
Notes
- Although
KURTis specified as taking a maximum of 30 arguments, Google Sheets supports an arbitrary number of arguments for this function. - If the total number of values supplied as
valuearguments is not at least two,KURTwill return the#NUM!error. - Any text encountered in the
valuearguments will be ignored. - Positive kurtosis indicates a more "peaked" distribution in the dataset, while negative kurtosis indicates a flatter distribution.
See Also:
VARPA: Calculates the variance based on an entire population, setting text to the value `0`.
VARP: Calculates the variance based on an entire population.
VARA: Calculates the variance based on a sample, setting text to the value `0`.
VAR: Calculates the variance based on a sample.
STDEVPA: Calculates the standard deviation based on an entire population, setting text to the value `0`.
STDEVP: Calculates the standard deviation based on an entire population.
STDEVA: Calculates the standard deviation based on a sample, setting text to the value `0`.
SKEW: Calculates the skewness of a dataset, which describes the symmetry of that dataset about the mean.
DEVSQ: Calculates the sum of squares of deviations based on a sample.
AVEDEV: Calculates the average of the magnitudes of deviations of data from a dataset's mean.
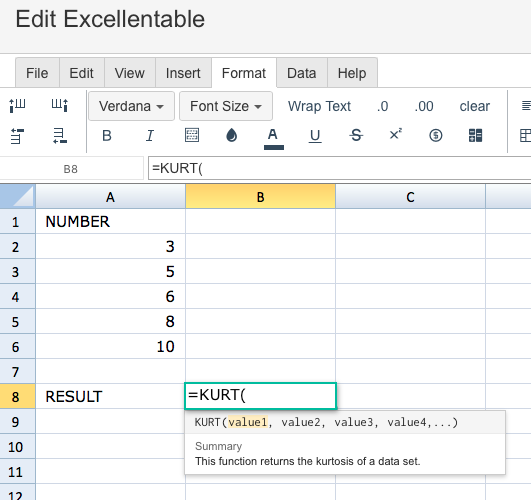
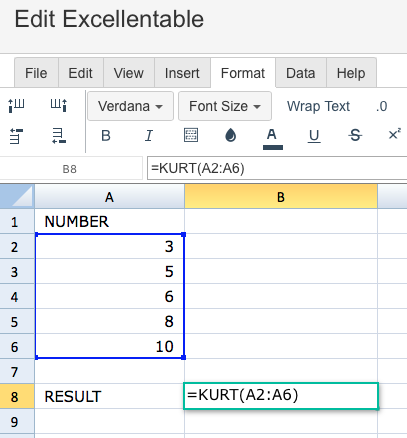
To use the KURT Formula, simply begin with your edited Excellentable:
Then begin typing the KURT formula in the area you would like to display the outcome: